Site dashboard
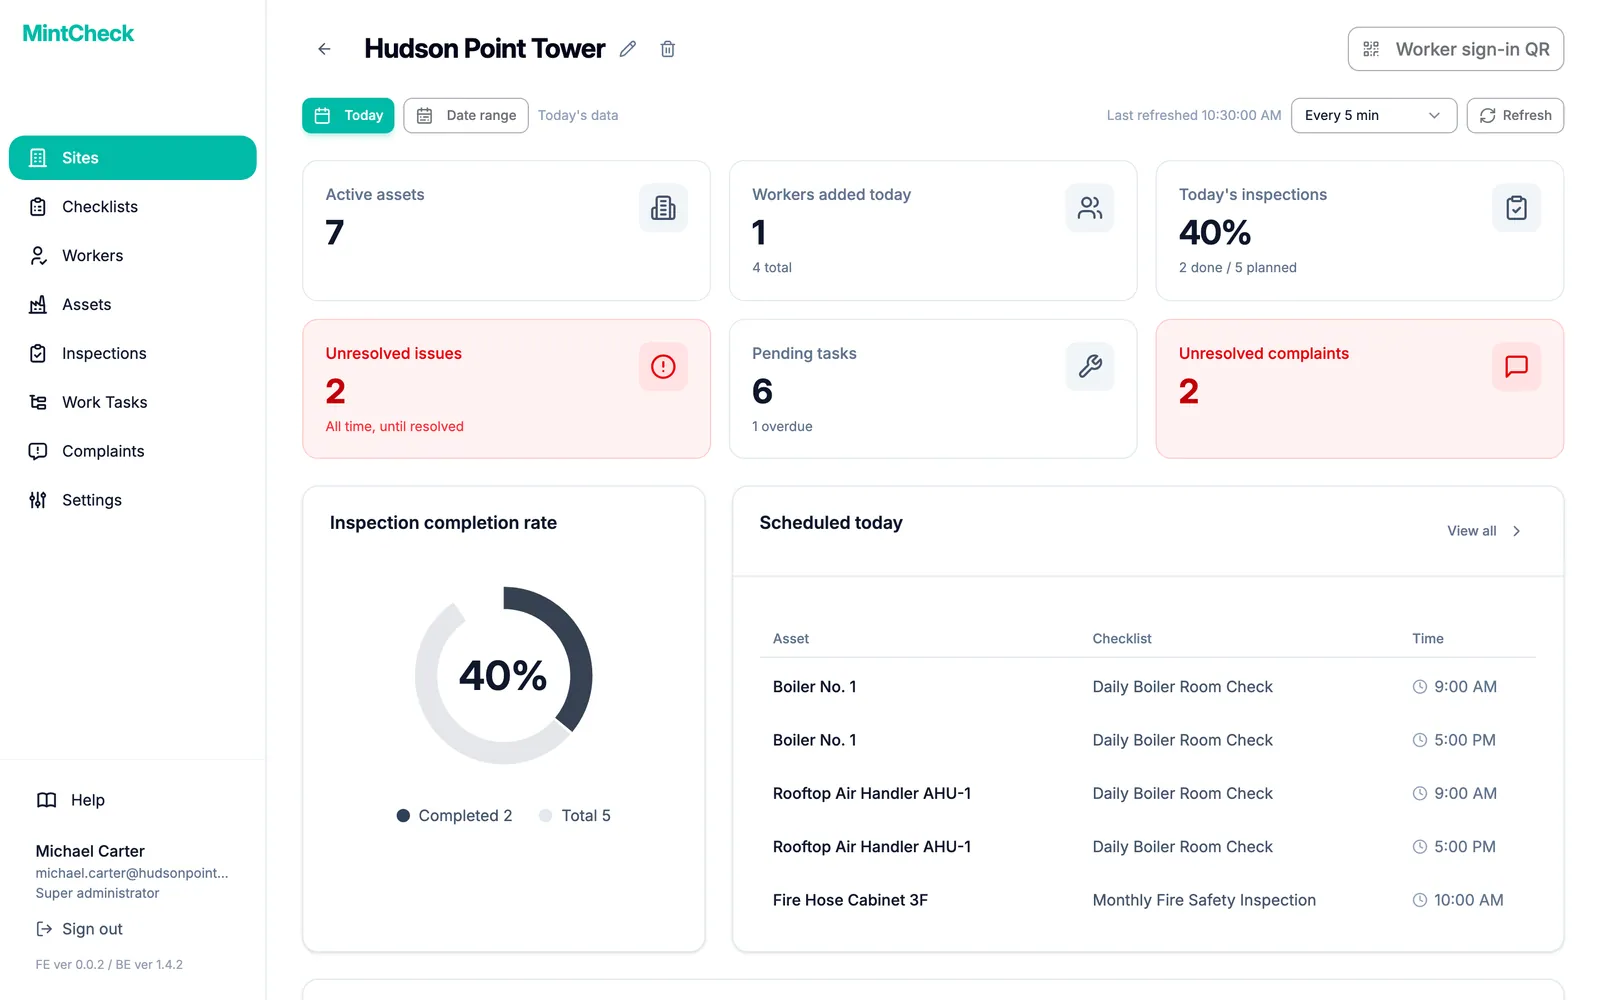
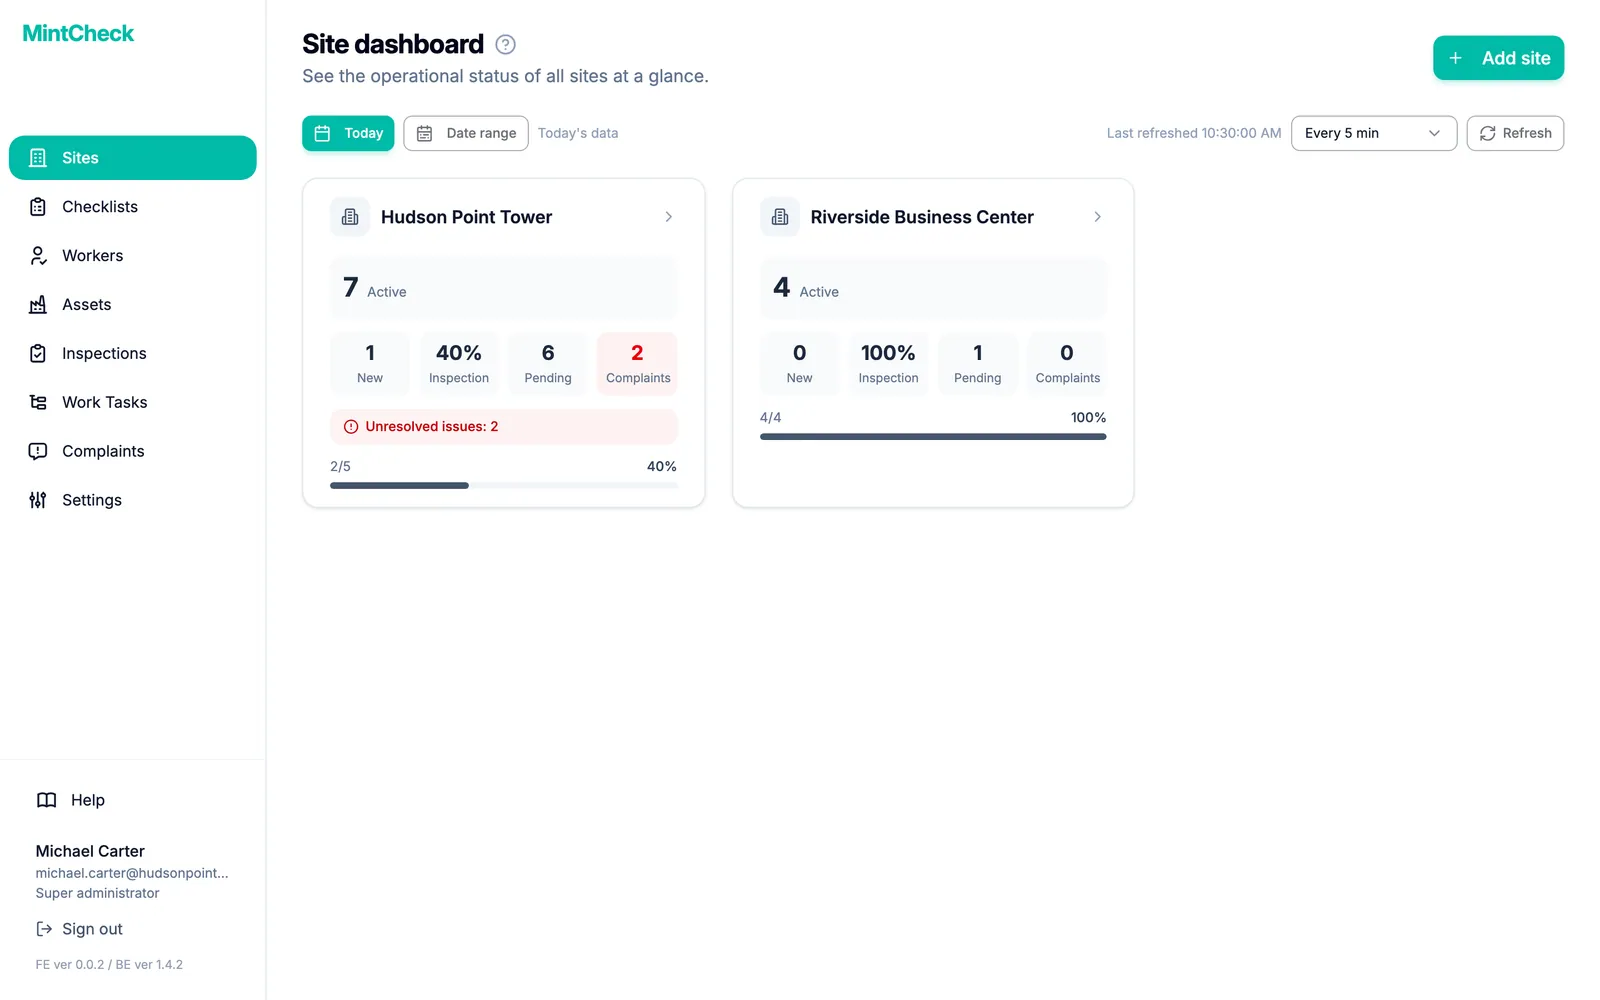
The MintCheck site dashboard shows how each site is doing at a glance: today's inspection completion rate, problems found during inspections that are not resolved yet, open and overdue tasks, and unresolved complaints. Cards turn red when something needs attention, and the dashboard refreshes itself.
How it works
- 1
Check the key numbers
Cards show active assets, today's inspections done out of planned, pending tasks, unresolved complaints and unresolved issues. Click a card to open the matching list.
- 2
See today in detail
Below the cards are the completion rate chart, what is scheduled today, the inspections already submitted with the worker and result, and the open tasks.
- 3
Look back over a period
Choose a date range to add up everything in that period, or go back to today with one click.
Good to know
- Refreshes automatically, from every minute to every 30 minutes.
- Each checklist time slot counts once for every linked asset, so the completion rate reflects the real work.
- Re-inspections and logbook entries don't inflate the completion rate.
- Times are shown in your own device's time zone.
Questions
How is the completion rate calculated?
Completed inspections divided by planned inspections. Each time slot of a checklist counts once for every asset linked to it. Logbook entries and re-inspections are not counted.
Can I see more than one day?
Yes. Choose a start and end date, and the numbers add up every day in that period.
Can I keep it open on a screen in the office?
Yes. Set the auto-refresh to 1 or 3 minutes and you will see finished inspections and new complaints as they come in.
Learn more in the help center
- Sites and the site dashboardAdd, rename, and delete sites, read each site's dashboard, change the period, and switch between sites.
- Inspection recordsReview completed inspections by day or period, check reported problems, and export records to Excel.
- ChecklistsCreate checklists from templates, add items, set schedules, link them to assets, and manage them.